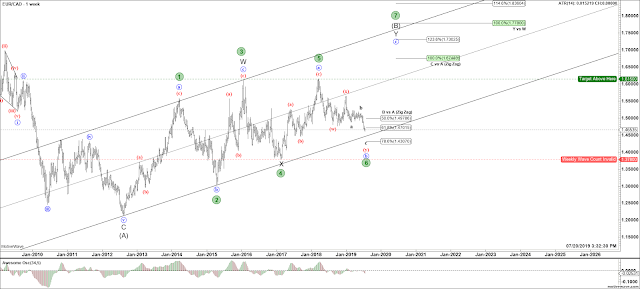
A correction in Elliott Wave happens in 3,7 or 11 swings while impulse waves are 5,9,13 ect. On the Weekly EURCAD chart we can see 5 swings up from the Aug12, 2012 low of 1.2130. I have marked these swings with the green numbers.
With the 5 overlapping swings up from the low, we could have a leading diagonal A wave complete with a B wave in progress. I don't not think that is the case because the 5th wave barely broke above the 3rd wave and it just doesn't have the right look for me.
If that 5th swing is not wave 5 of the Leading Diagonal then it most be a of Y as I have it labeled. Either way I see more upside in the EURCAD after this 6th swing or b wave is completed. The minimum upside target is 1.6150.
EURCAD Weekly Elliott Wave Count
 |
| EURCAD Weekly Elliott Wave Count |
